The Glycemic Alpha-Cell
Regulation Model
In this section we test the idea of developing an empirical dose-response model using insulin, we apply this methodology to the glucose-glucagon data for nondiabetics, and we then examine glucagon response in T1D subjects.
Insulin responds closely to circulating glucose
As a preliminary test of our methodology for measuring the glucagon dose-response to glucose, we looked at the equivalent insulin dose-response. As shown in Exhibit 10, the correlation with a linear regression analysis is excellent: the R-squared is 0.89 for healthy subjects over three meals in the diurnal study. A logarithmic curve fit gives almost exactly the same R-squared value.

As a check on whether the diurnal study is representative of a more general insulin dose-response, we compared the correlation provided by the simple carbohydrate study to that of the diurnal study following breakfast, as shown in Exhibit 11. The R-squared for the simple carb data is 0.95, even higher than that from the diurnal study. The dose-response slope from the simple carb data is 11% higher than the diurnal data slope; a possible explanation might be that the diurnal study missed the actual peak of the insulin response by not taking measurements at 40 and 50 minutes after the meal, as suggested by Exhibit 16.

As a further check on the insulin dose-response, we compared the results for the simple carb study to the those of the complex carb study. The complex carb subjects achieved an average increase in postprandial glucose level over basal of about half the increase over basal in the simple carb study. Nevertheless, the R-squared for the complex carb dose-response was 0.94, almost identical to that of the simple carb dose-response at 0.95 (Exhibit 12). The calculated slope of the complex carb dose-response was 36% higher than the simple carb; this robust dose-response for the complex carb study suggests that glycemic control of insulin secretion was fully active, even though the postprandial glucose increase was muted by the delay in complex carbohydrates raising blood glucose. This observation will be revisited during the discussion of the glucagon dose-response in the complex carb study.

In Exhibit 13 we use the insulin dose-response model from the diurnal study to predict a profile of circulating insulin, and we compare it to the actual profile of circulating insulin.

The glucose-mediated model accounts for about 80% of the actual insulin profile (R-squared = 0.80), and it diverges from reality in two ways:
The actual insulin response to breakfast is more robust than predicted, and the actual response to dinner is blunted. The breakfast difference is reflected in the dose-response slopes of the breakfast (3.2) and three-meal (2.6) equations of the diurnal study: the breakfast slope is 24% greater than the slope generated by the profiles from three meals (see Exhibits 10 and 11 for the linear regression equations).
By about three hours postprandial actual circulating insulin has somewhat disengaged from the predicted dose-response relationship. As can be seen in Exhibit 5, following its postprandial spike, circulating glucose declines past its preprandial level and then recovers. Circulating insulin does not follow this glucose overshoot/snapback pattern, but simply returns to its preprandial level.
A plausible mechanism for nonglycemic insulin deviations could be variations in beta-cell sensitivity. Meanwhile, the 90%+ correlation between circulating glucose and insulin levels is consistent with general knowledge that beta-cell secretion is mostly driven by response to rising blood glucose levels. Thus, we move on to using this methodology to explore the glucagon dose-response with increased confidence that our empirical modeling is consistent with general knowledge about islet hormone response to rising blood glucose.
Glucagon response is only partially
glucose driven in nondiabetics
Exhibit 14 plots glucose vs. glucagon blood concentrations for the diurnal study data of nondiabetics.

The best fit is a logarithmic curve described by this equation:

This equation will be termed the “glycemic model.”
The R-squared value is 0.59, which implies that – in this population of nondiabetics under the conditions tested – close to 60% of the diurnal variation in circulating glucagon is explained by variations in circulating glucose. The first derivative of the dose-response is Y = -59.6/x; as glucose concentration increases, the rate of glucagon decline decreases.
As a rough check on whether there is a lag between glucose and glucagon, the correlation was run by shifting glucagon forward one time period (e.g. the glucagon value at 60 minutes was correlated to the glucose value at 30 minutes); the slope of the regression declined about 5%, and the R-squared dropped from 0.59 to 0.54. Thus, it appears that, for the time intervals tested, using simultaneous circulating concentrations of glucose and glucagon is appropriate for the glycemic model.
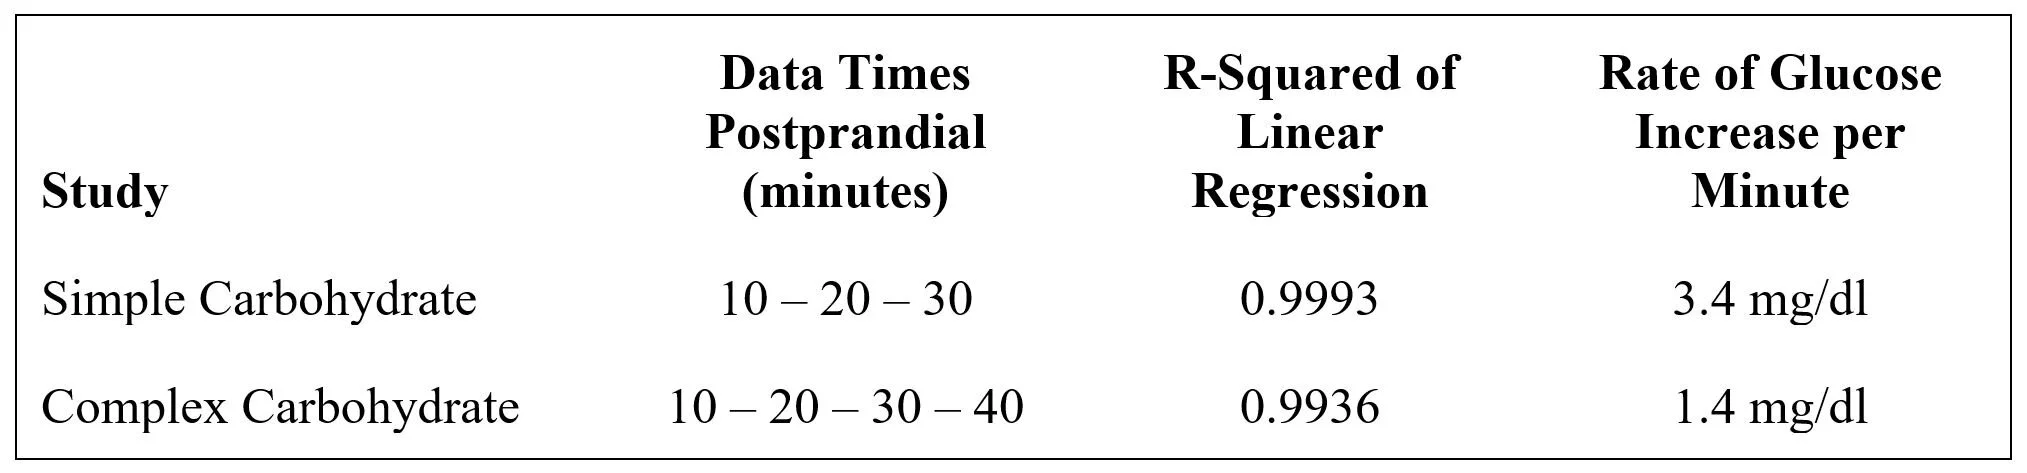
Exhibit 15 plots glucose vs. glucagon blood concentrations for the carbohydrate studies.

While the simple carb shows an R-squared of 0.49, the complex carb slope and correlation are both close to zero. This suggests that, in this study design, the simple carb activated glycemic regulation of glucagon, but the complex carb did not produce a strong enough glycemic effect to show up in the correlation analysis.
For both simple and complex carbs, glucagon displayed the first phase postprandial glucagon increase (Exhibit 4), but suppression of this peak was substantially stronger for the simple carb, as was the subsequent decline from that peak:
Three mechanistic explanations for the complex carb failure to regulate glucagon are plausible:
Insufficient glucose was absorbed from the complex carbohydrate: Exhibit 16 shows the postprandial glucose profiles of the nondiabetic diurnal and carbohydrate studies. (Note that the diurnal study may have missed the peak glucose level by not testing at 40 and 50 minutes.) The complex carb AUC above the basal level at time 0 is about 80% of that for the simple carb; thus, the complex carb resulted in a somewhat lower glucose loading than did the simple carb. The insulin AUC above basal in the complex carb study was 79% of the simple carb AUC; thus, glycemic regulation of insulin reflected response to glucose in both studies. This suggests that something other than the 20% reduction in net carb load accounts for the complete loss of glycemic correlation to glucagon.
Glucose did not reach a threshold level for activation: When the four highest glucose levels (above ~135 mg/dl) are deleted from the simple carb correlation, the R-square declines somewhat to 0.36 and the slope of the dose-response becomes much steeper. This is consistent with the conclusion that glycemic regulation of glucagon was occurring at the lower glucose levels for the simple carb study, and that there is no concentration threshold for activation.
Glucagon stimulation is sensitive to the rate of glucose increase: The simple carb meal resulted in a rate of glucose increase that was 143% faster than that of the complex carb meal (data from Exhibit 16):

Since the glucagon dose-response appears to have occurred in the simple carb study below the maximum level achieved in the complex carb study, it seems likely that a threshold rate of glucose increase is required to activate glycemic regulation of alpha-cells.
One hypothesis proposed for glycemic control of alpha-cell secretion is that insulin exerts a paracrine effect between the beta- and alpha-cells. However, these observations about the glucagon dose-response to rising glucose are consistent with the following conclusion: insulin secretion does NOT activate glucagon secretion.
As shown in Exhibit 12, insulin levels are under tight, 90%+ control by glucose regardless of the magnitude and timing of postprandial glucose increases.
In contrast as shown in Exhibit 15, postprandial glucagon response is only about 50% explained by rising glucose in the simple carb study, and there is no glucagon response to glucose in the complex carb study.
Exhibit 17 compares the glucagon dose-response resulting from the simple carb study to that of the diurnal study (the glycemic model).

Both studies included mixed meals with the same amount of Jell-O; however the diurnal study blended averages for selected breakfast, lunch, and dinner meals, whereas the simple carb study was only breakfast. The similarity of glucagon correlation equations between the two different studies increases our confidence that, for the conditions tested, the diurnal glucose model is a good reflection of the postprandial glucagon dose-response to circulating glucose. Clearly this model does NOT apply to meals based on complex carbohydrates.
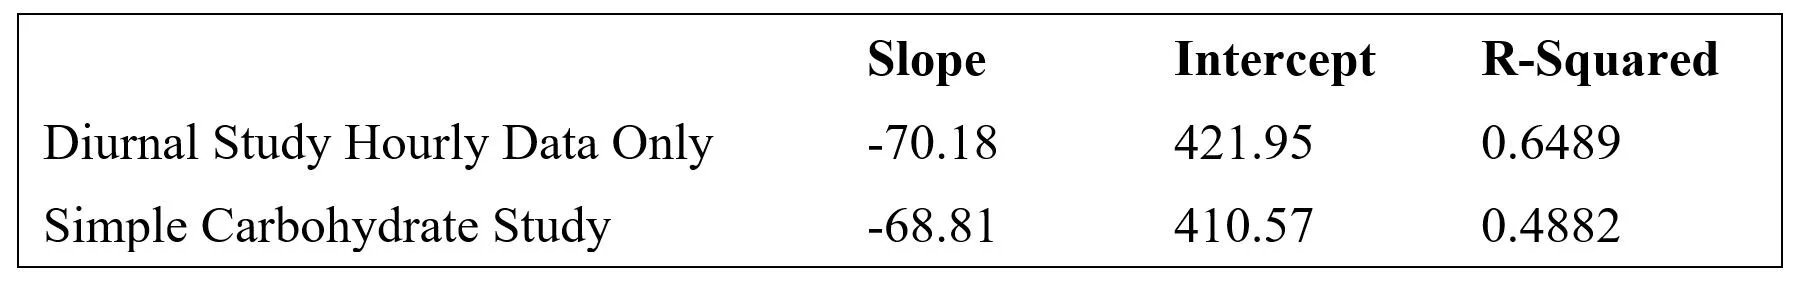
In both the diurnal and simple carb studies, more frequent data points were collected early in the postprandial period. To test whether this skewed the regression analysis, a correlation was done using only the hourly diurnal data, as shown in Exhibit 18.

The slope of the logarithmic curve increased about 16% and the R-squared increased to 0.65. Most of the deviation between the all-data and hourly-data glycemic correlations occurred at the lowest glucose concentrations, i.e. at 90 mg/dl, glucose-predicted glucagon based on hourly-data exceeded that predicted by the all-data by about 6%, while there was virtually no deviation between models at 190 mg/dl. This relatively small deviation suggests that the pattern of blood tests did not distort the correlation analyses.
Interestingly, the use of only hourly data in the diurnal study resulted in a correlation equation very close to that of the simple carb study:
For the remainder of this paper we use the glycemic model derived from all the data points in the diurnal study.
When 90 mg/dl is set as a “basal” level of blood glucose, Exhibit 19 shows the projected decline in circulating glucagon as blood glucose rises above basal level.

At 190 mg/dl glucose (about the peak level of glucose twice per day in nondiabetics following lunch and dinner), this glycemic model predicts glucagon will decline 44% to about 56 pg/ml. As shown in Exhibit 9, glucagon concentrations in nondiabetics do reach a nadir of about 60 pg/ml after meals.
In Exhibit 20, the glycemic model is used to predict the glucose-dependent component of glucagon levels in healthy nondiabetics, which is then compared to their actual glucagon circulating concentrations.

There are three times of deviations in the profiles, as shown in Exhibit 21.
Prandial (red): During the first ten minutes following the start of mealtimes, glucagon spikes briefly before glucose begins rising and glycemic control of alpha-cell secretion kicks in, presumably because of protein stimulation of alpha-cells.
Postabsorption (orange): About 1.5 hours postprandial when blood glucose has returned to basal concentrations, circulating glucagon begins to rise and peaks at 3-4 hours postprandial before beginning to decline toward fasting levels, perhaps to suppress hunger and accommodate a negative energy balance during exercise.
Fasting (purple): Starting about six hours after dinner, circulating glucagon declines below levels predicted by glycemic regulation, presumably to compensate for the sleep cycle.

These deviations from the glycemic model predictions will be addressed by the nonglycemic model.
Another way to visualize the nonglycemic perturbations in circulating glucagon is shown in Exhibit 22.

The three postprandial averages for circulating glucagon (blue, green, and orange lines) are shown in the context of the glucagon levels predicted by the correlation between glucose and glucagon (red dashed line) using the three-meal average glucose profile. The overnight fast changes the breakfast profile from the lunch and dinner profiles somewhat, but the patterns are the same. During the time when glucose is driving the glucagon levels, the three meals show virtually the same minimum, with the postabsorption breakfast profile peaking an hour before the lunch and dinner profiles. From four hours postprandial the glucagon profiles are in perfect alignment, except that breakfast and lunch declines toward basal are interrupted by the next meal.
From these profiles it is evident that the only time glucose has an impact on alpha-cell secretion is during the postprandial period when exogenous glucose influx is occurring. At this time, alpha-cells secretion is suppressed to minimize glucose influx from the liver.
There is no glucagon dose-
response to glucose in T1D
In Exhibit 23 the glucagon dose-responses for nondiabetics and T1Ds are compared based on data from the diurnal study.

In T1D there is NOT a correlation between glucose and glucagon:
R-squared equals 0.04, which is consistent with a lack of a direct regulatory connection between glucose and glucagon in T1D. In other words, the mechanism which suppresses glucagon secretion as blood glucose rises is missing in T1D.
The regression equation shows a slightly positive slope that is contrary to the well documented effect of rising glucose on glucagon levels in nondiabetics; hence, the true value of this slope is probably zero.
It is unlikely that this lack of alpha-cell response to rising glucose is caused by a rate of change in T1D below the necessary threshold. As seen in Exhibit 7, the immediately postprandial slopes of the nondiabetic and T1D glucose profiles are essentially parallel.
This finding is inconsistent with the idea that glucose concentration is directly sensed by alpha-cells, because alpha-cells in T1D otherwise appear to be relatively normal. Rather it supports the hypothesis that the deficit in glycemic regulation of glucose is caused by the primary underlying etiology of T1D, which is the deletion of beta-cells. I.e., beta-cells have the glucose sensory mechanisms that regulate alpha-cell response to circulating glucose.
In Exhibit 24 we use the glycemic model to predict circulating glucagon in T1D.

The green triangles show what glucagon concentrations would be if the glycemic model was effective in T1D; the red circles show actual glucagon concentrations in T1D. The results indicate that T1D subjects are relatively hyperglucagonemic between meals, because glucagon levels fail to decline as predicted by the glycemic model derived from healthy subjects. Based on AUCs, the resulting excessive daily exposure to circulating glucagon is about 35% above what normal glucose regulation of glucagon would be expected to achieve.