The NonGlycemic Alpha-Cell
Regulation Model
Based on the glycemic model, we can now examine the half of the glucose-glucagon diurnal profile that is not explained by changes in glucose. The question we ask: is there a clear pattern of diurnal glucagon changes which would imply nonglycemic regulation of alpha-cells?
Exhibit 25 shows the percentage deviation of actual glucagon levels in nondiabetics from the levels predicted by the glycemic model (Actual / Predicted – 1).

The diurnal pattern of deviations is repetitive, as shown in Exhibit 26, which superimposes the three meal profiles, plus the average profile, on one five-hour scale.

These deviations do not appear to be random, but rather suggest systematic forcings of glucagon levels associated with mechanisms different from those that drive the glycemic correlation. The breakfast profile appears to deviate from the other two meals, with about three-fold greater suppression at time zero (basal level), and a shorter time to the postprandial nadir; this suggests that the longer overnight fast results in amplified suppression of circulating glucagon.
In Exhibit 27 we show a plot of the average postprandial glucagon deviations shown in Exhibit 26. The values along this plot will be termed the “Nonglycemic Alpha-Cell Regulation Model.” (The nonglycemic model.)

To consider whether this nonglycemic model is likely to be validated beyond the current diurnal study, we used the same approach with the data from the simple carb study. The result is shown in Exhibit 28, which compares the nonglycemic models from the diurnal and simple carb studies.

The resulting profiles are similar, except that the simple carb pattern starts lower and reaches its first nadir about one hour ahead of the diurnal study; this is consistent with the breakfast profile shift in the diurnal study (Exhibit 26). We interpret the similarity of profiles as preliminary evidence that the pattern of peaks and valleys seen in the deviation of the glycemic model predictions from the diurnal study data may be indicative of a universal nonglycemic model.
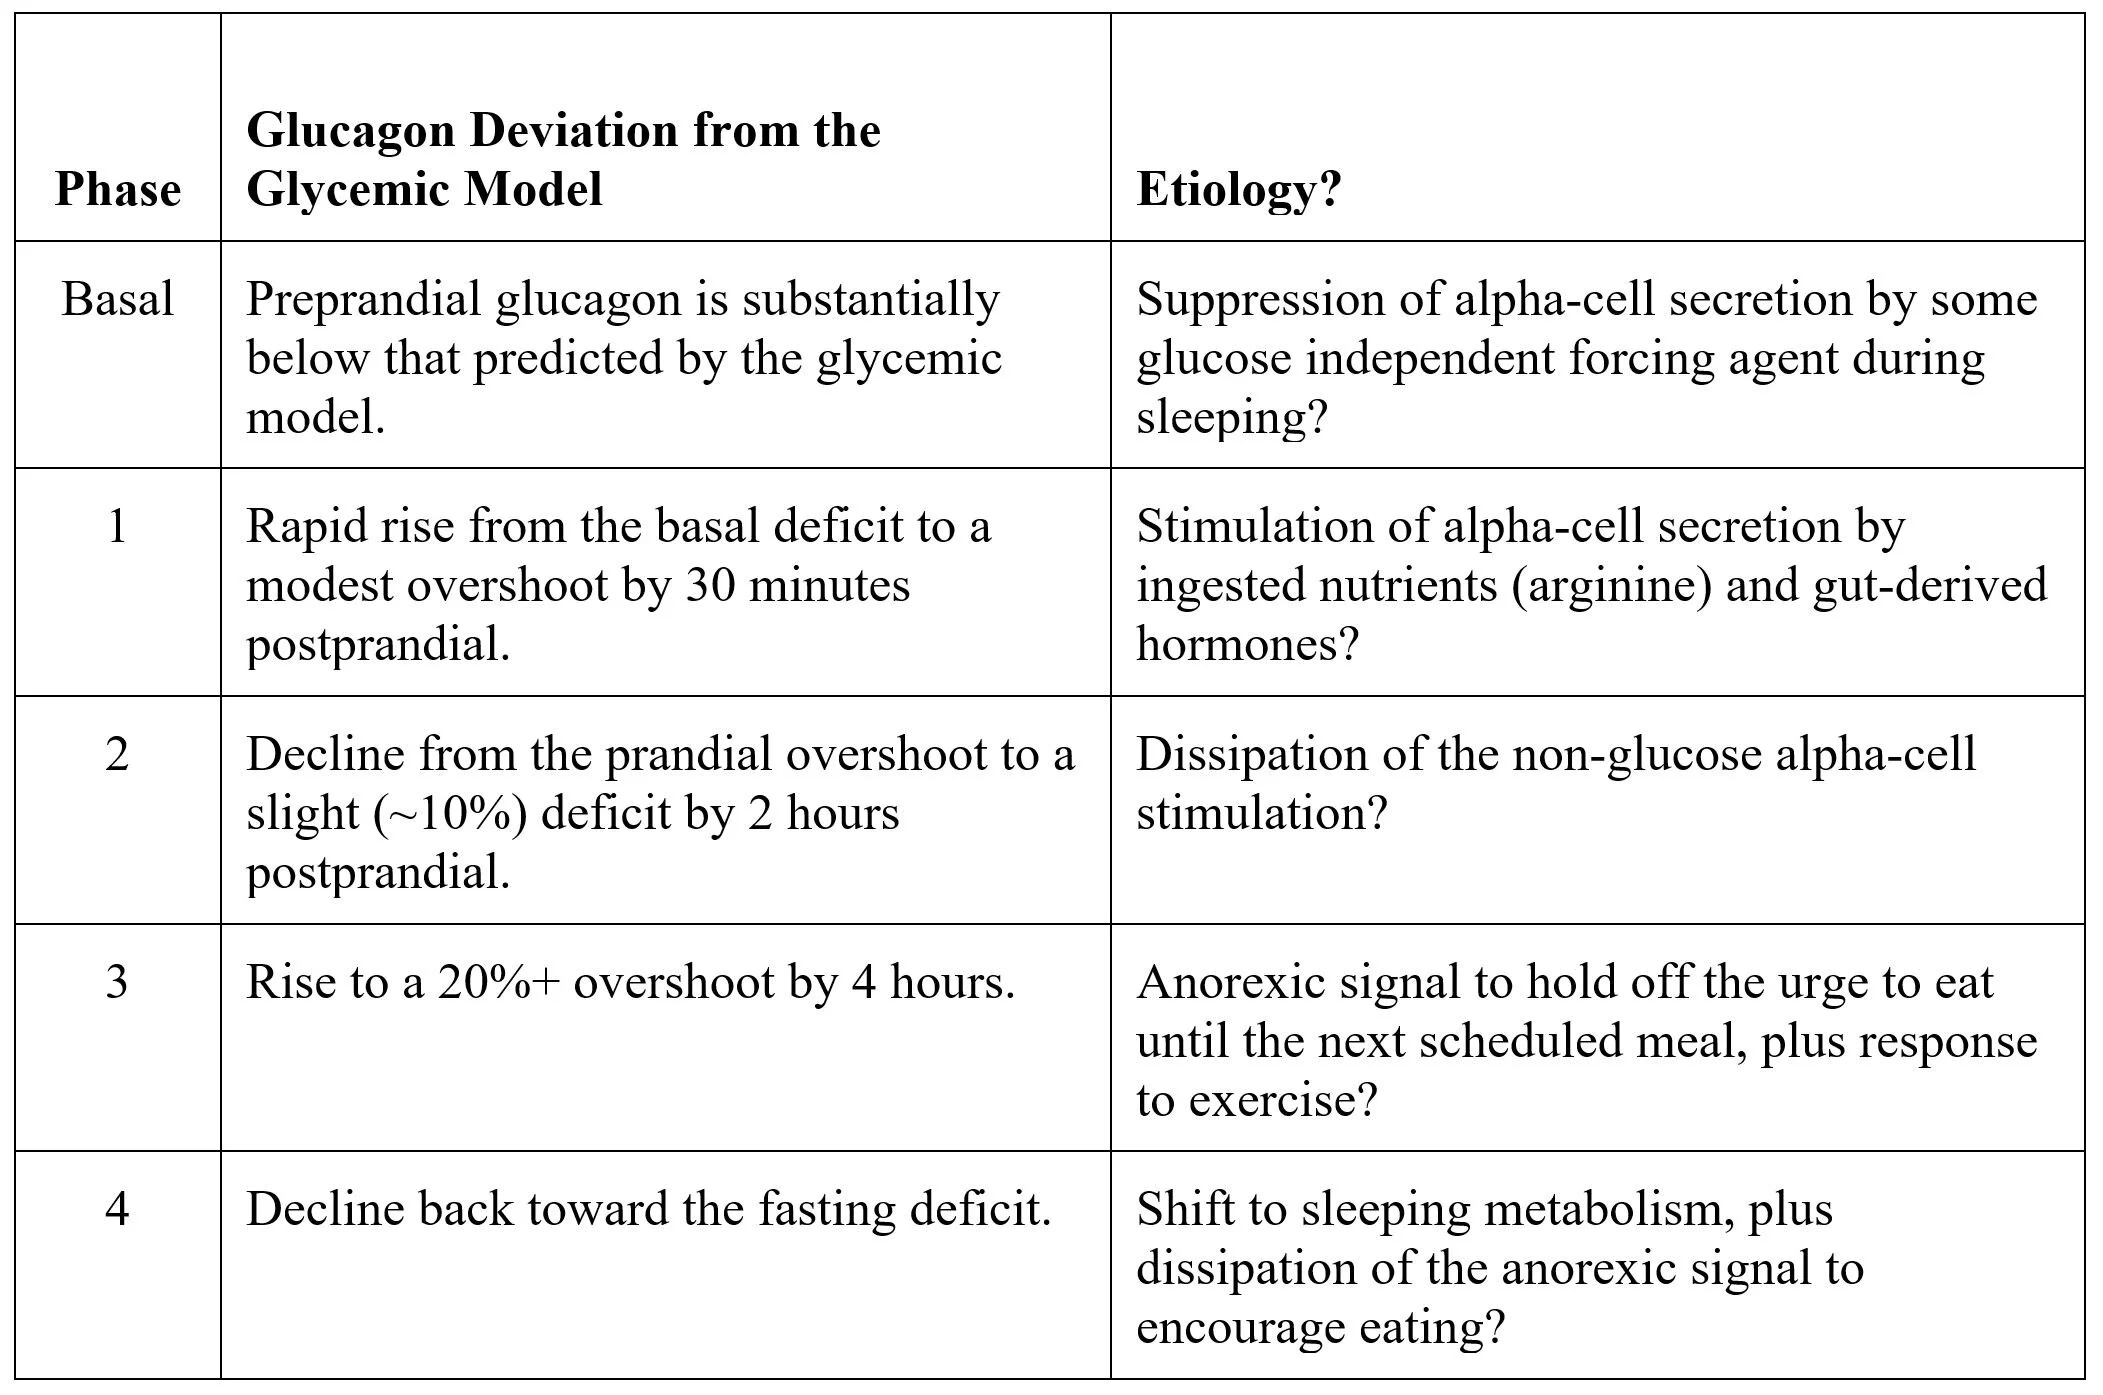
Exhibit 29 proposes that the postprandial nonglycemic model may be segmented into four distinct phases.

In this table we speculate about possible mechanisms to explain this profile:
The over- and under-shoot glucagon values relative to the glycemic model might also be consistent with a regulatory system that requires some time to settle toward the equilibrium determined by the glycemic regulation after being perturbed by the prandial glucose forcings, i.e. as would be seen in a damped oscillating system. However, as we will discuss shortly, the presence of roughly the same four-phase postprandial pattern in T1D argues against this hypothesis, since we showed in Exhibit 23 that there are no glucose forcings of glucagon in T1D.
An interesting question is why the pre-breakfast basal levels are hypoglucagonemic relative to the glycemic model prediction. Perhaps there is some glucose-independent background alpha-cell suppression signal that is overridden by the return to glucose driven suppression and postabsorption nonglycemic increases?